Shorted 2026: AI-Powered Reports, Redesigned Dashboard, and More


Shorted 2026: What's New
We've been busy. Over the past few months, Shorted has gone from a simple short interest tracker to a comprehensive market intelligence platform. Here's everything that's changed.
AI-Powered Weekly Reports
The biggest addition is our new weekly short selling reports. Every week, our system automatically analyses ASIC short position data and generates a comprehensive report covering:
- Top shorted stocks with week-over-week changes
- Biggest risers and fallers in short interest
- Industry analysis breaking down sector trends
- Market outlook with forward-looking commentary
- Financial snapshots pulling key metrics from recent company reports
Each report is generated using a multi-stage AI pipeline that combines market data analysis with narrative generation, producing reports that read like they were written by a financial analyst — because the AI was trained on thousands of them.
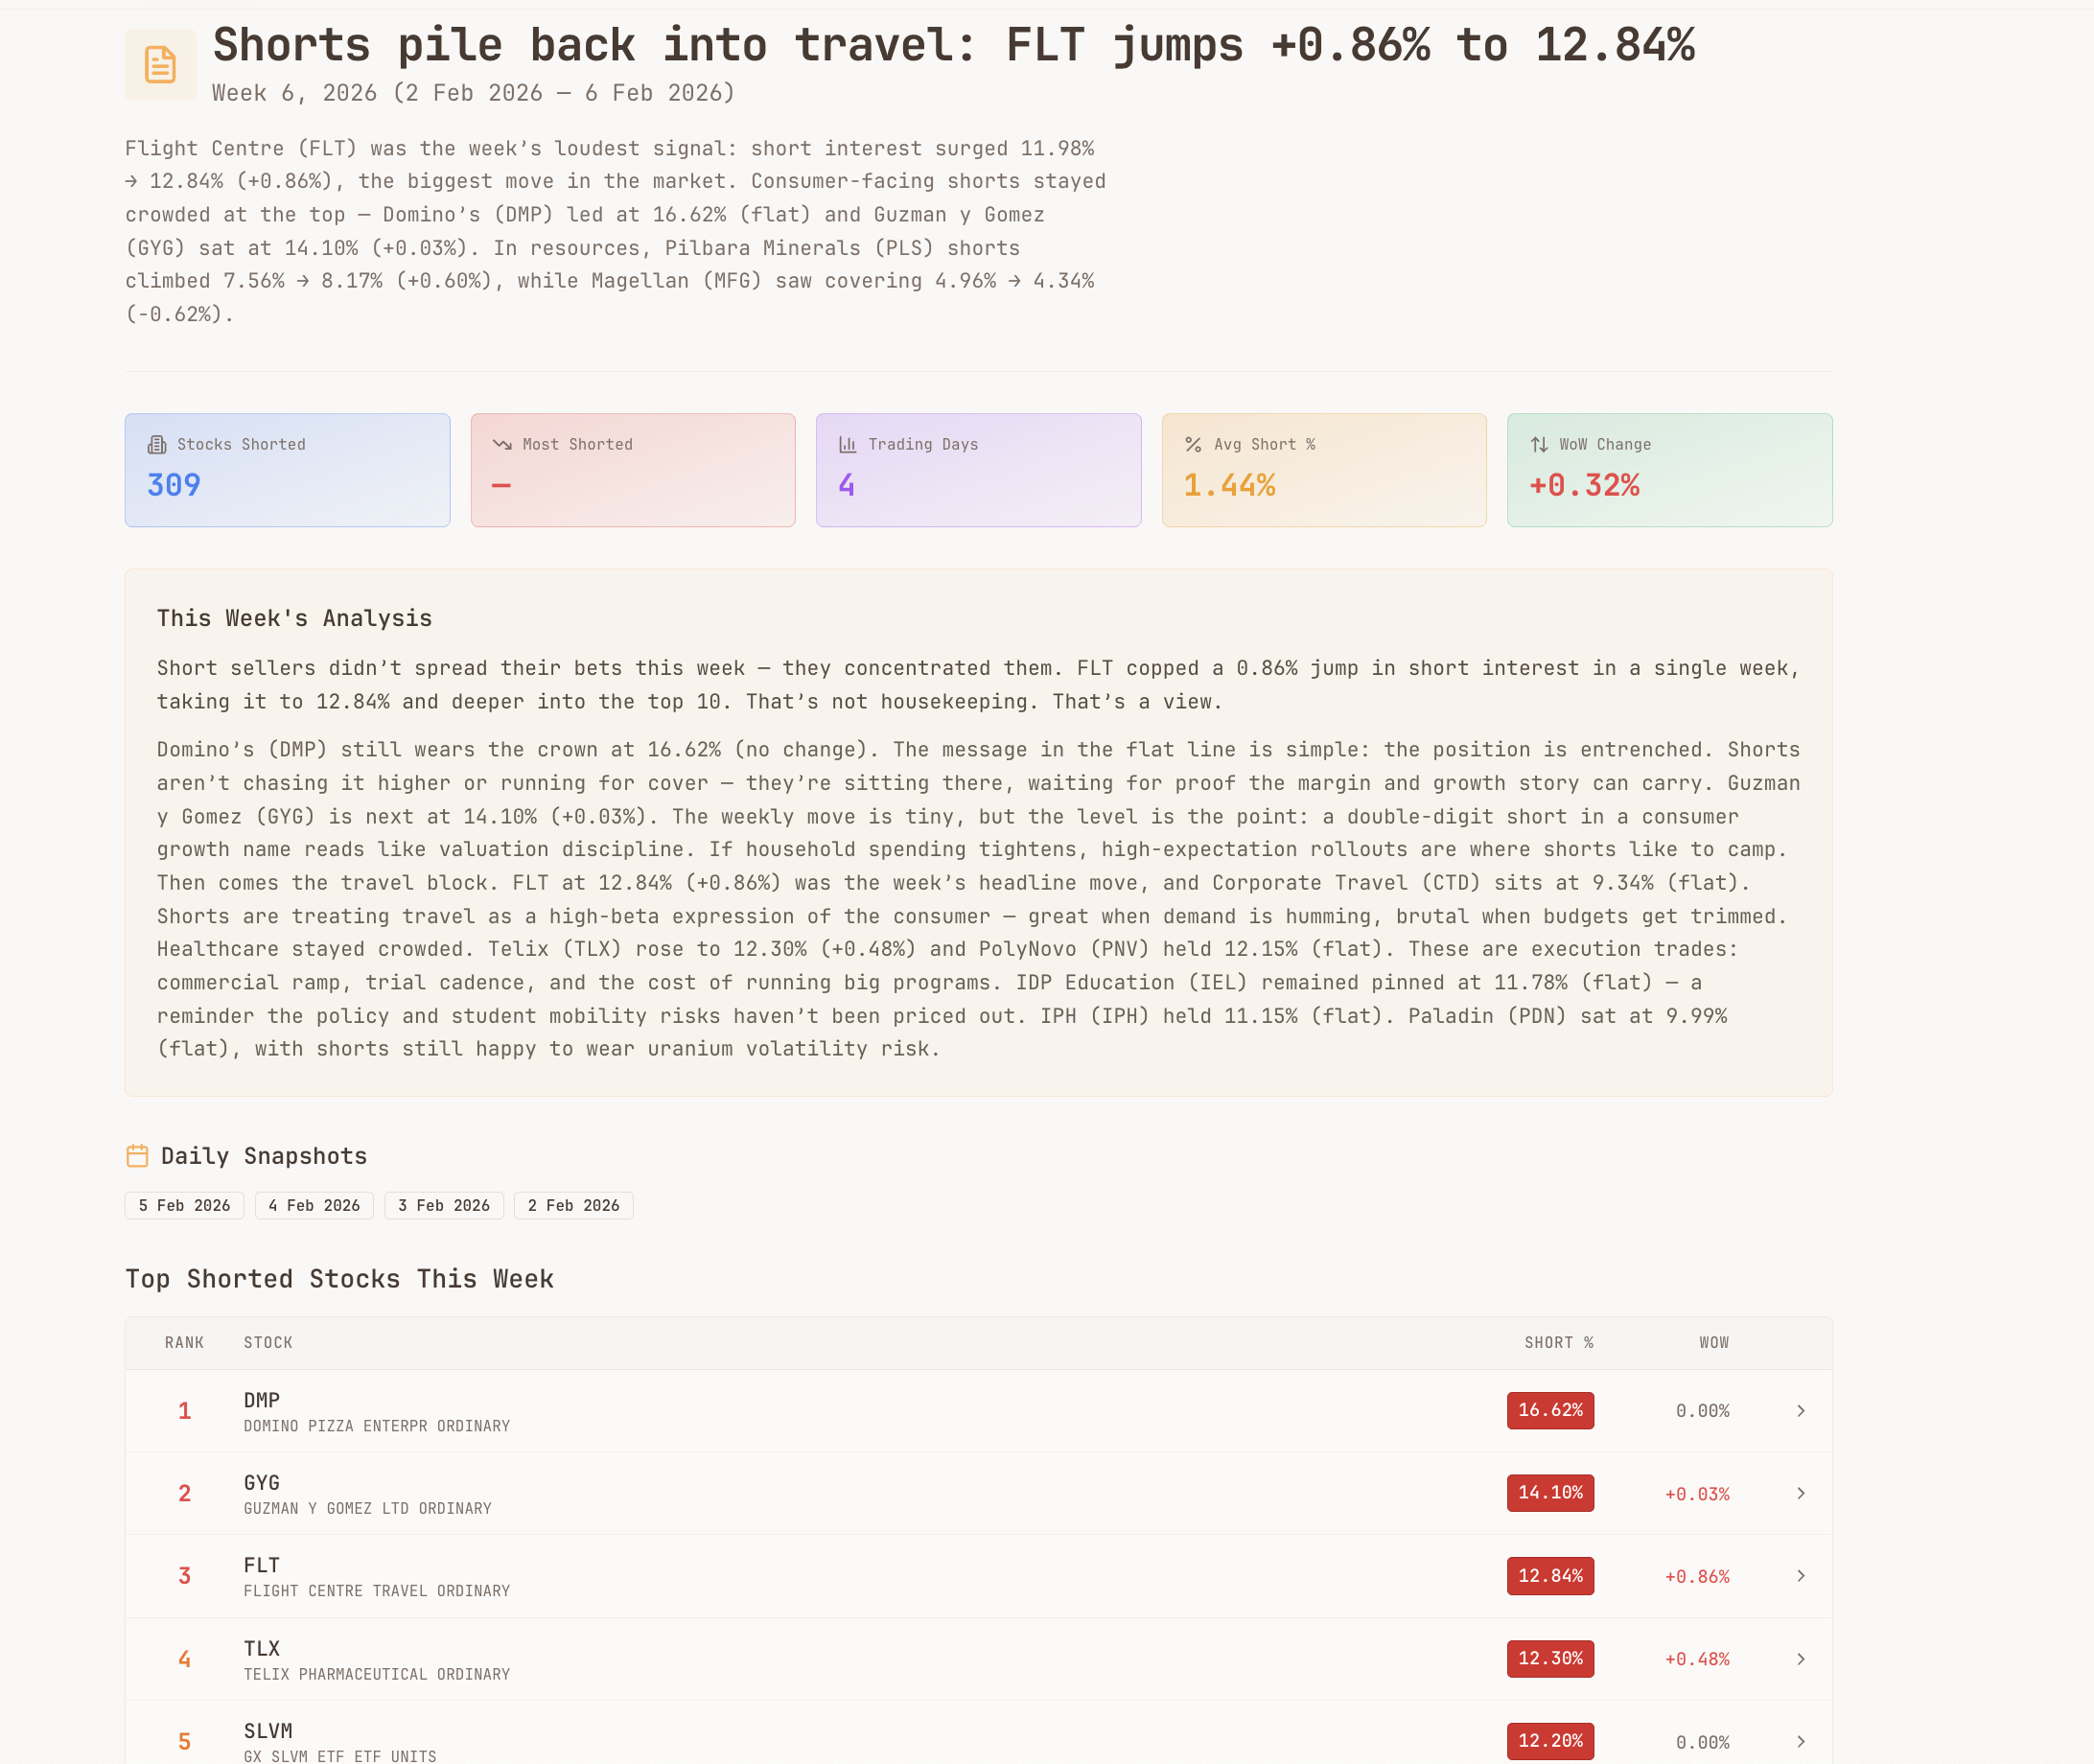
The reports update automatically after each trading week, and you can browse the full archive going back months.
Redesigned Top Shorted Page
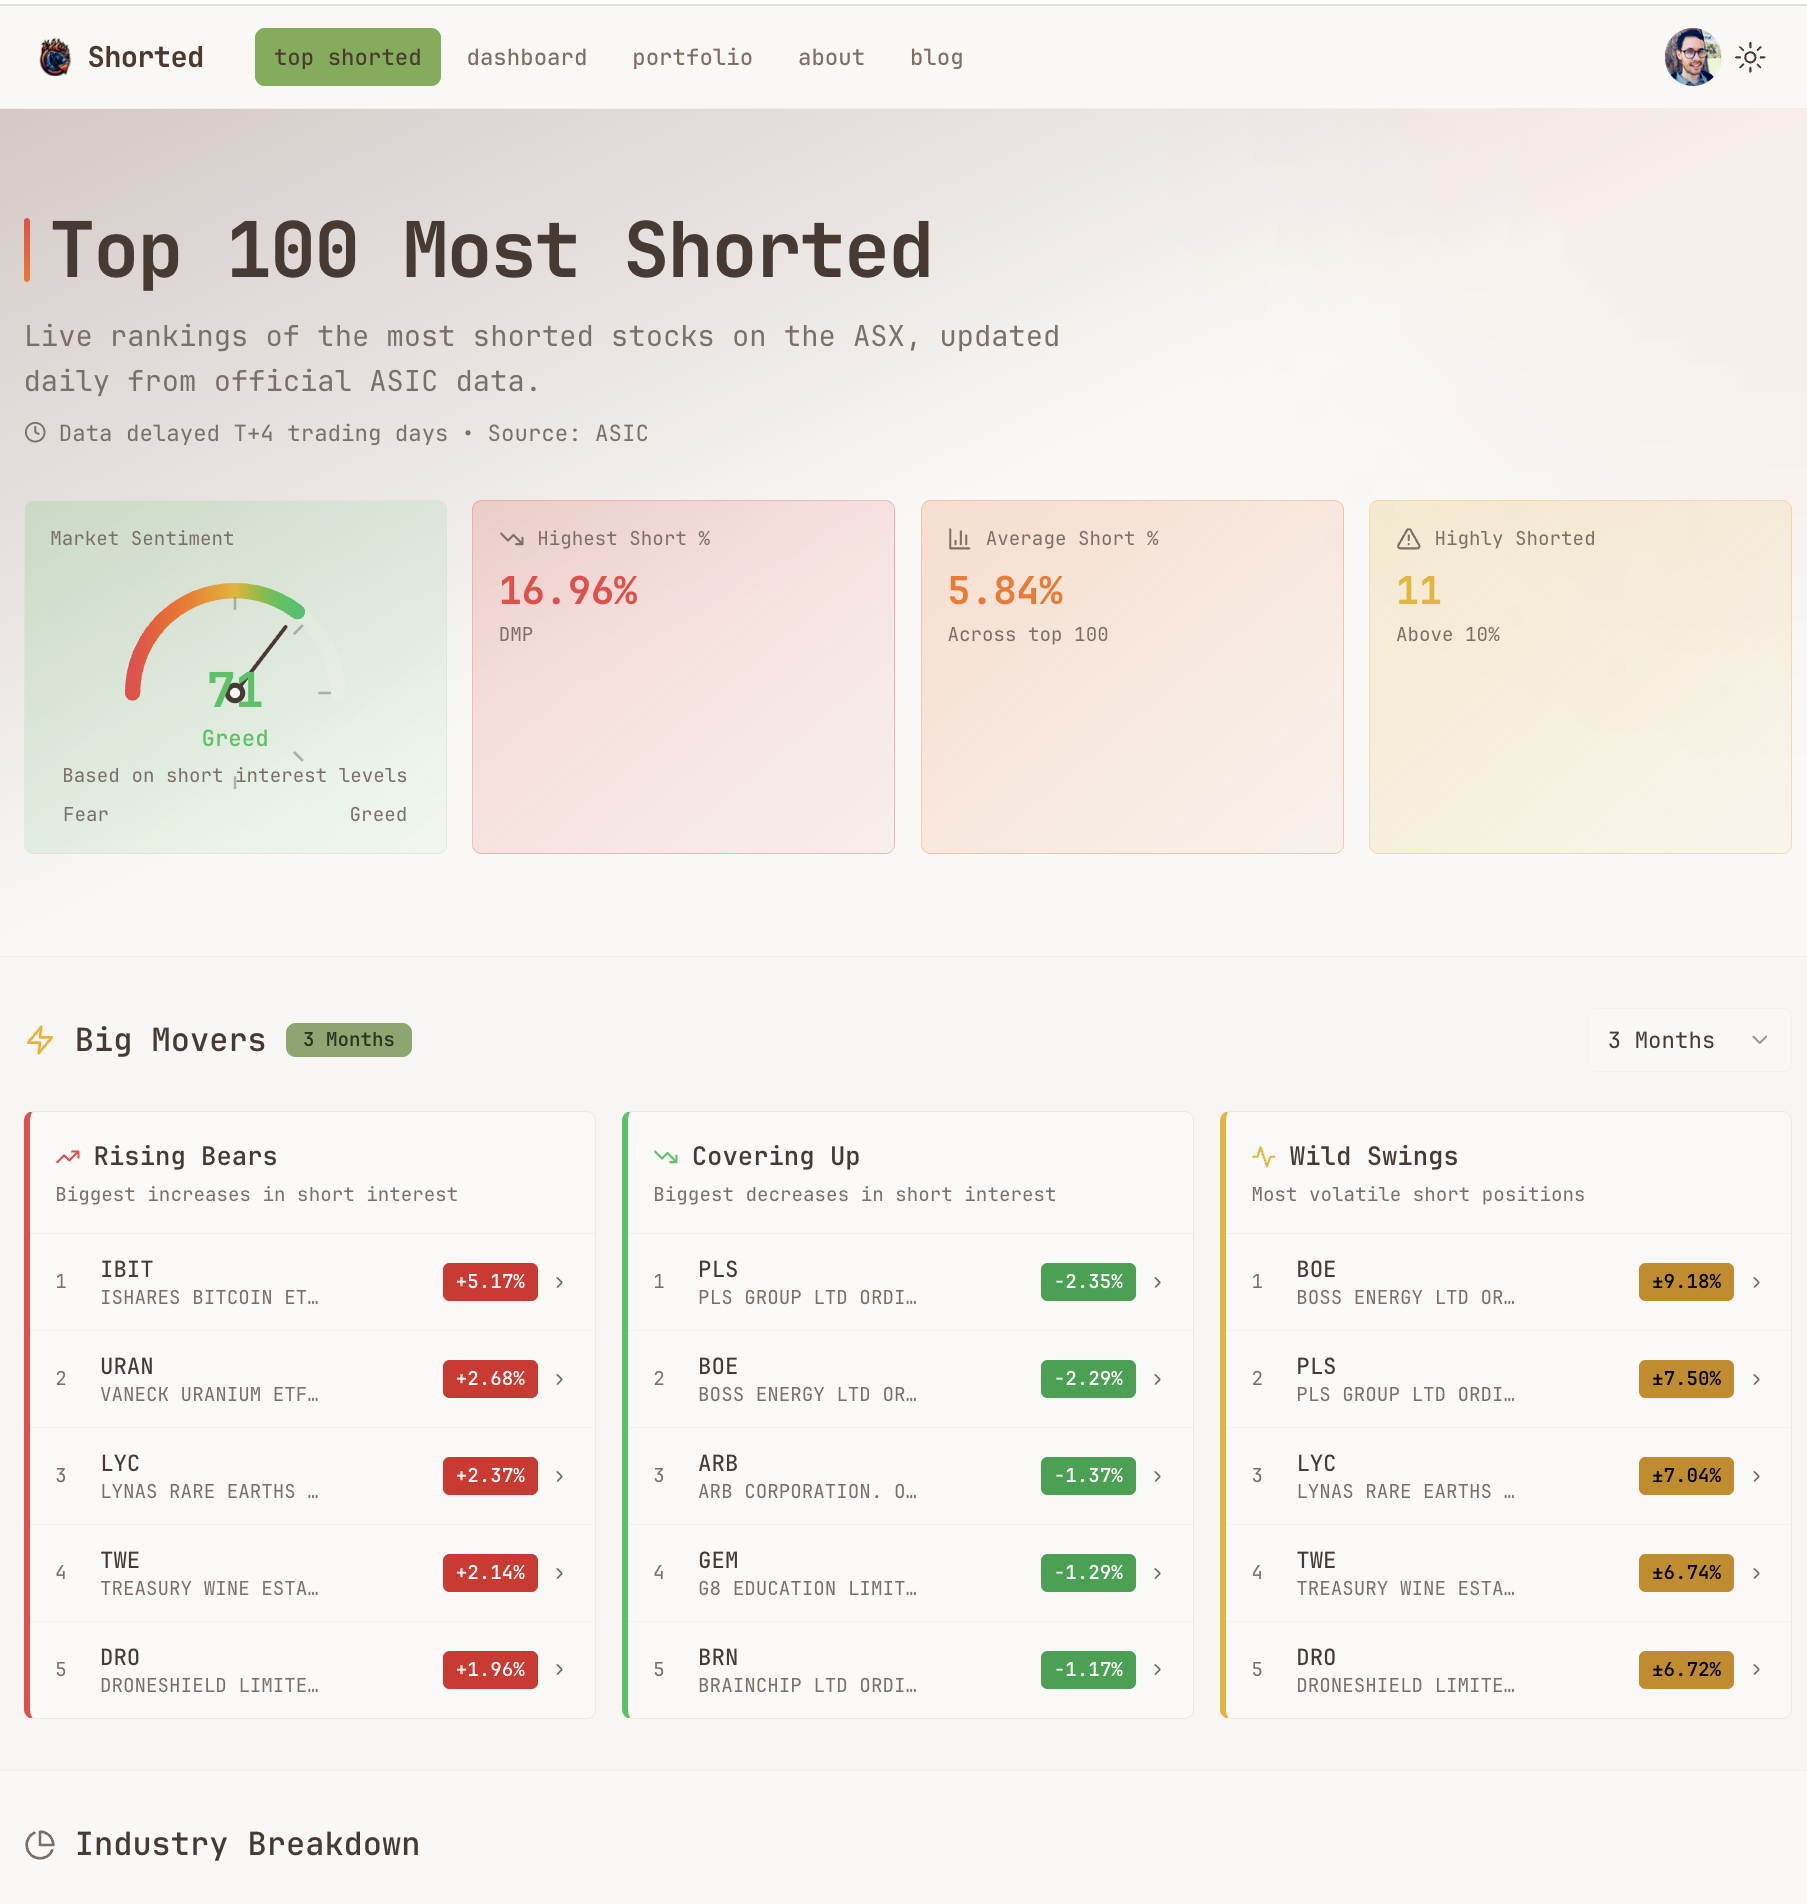
The top shorted stocks page has been completely rebuilt. The new design features:
- Market Sentiment Gauge — an at-a-glance indicator of overall short selling activity
- Key statistics — highest short %, average across the top 100, and count of heavily shorted stocks
- Big Movers section — rising bears, covering shorts, and the most volatile positions, all visible without scrolling
- Industry Breakdown — a treemap showing which sectors are attracting the most bearish attention
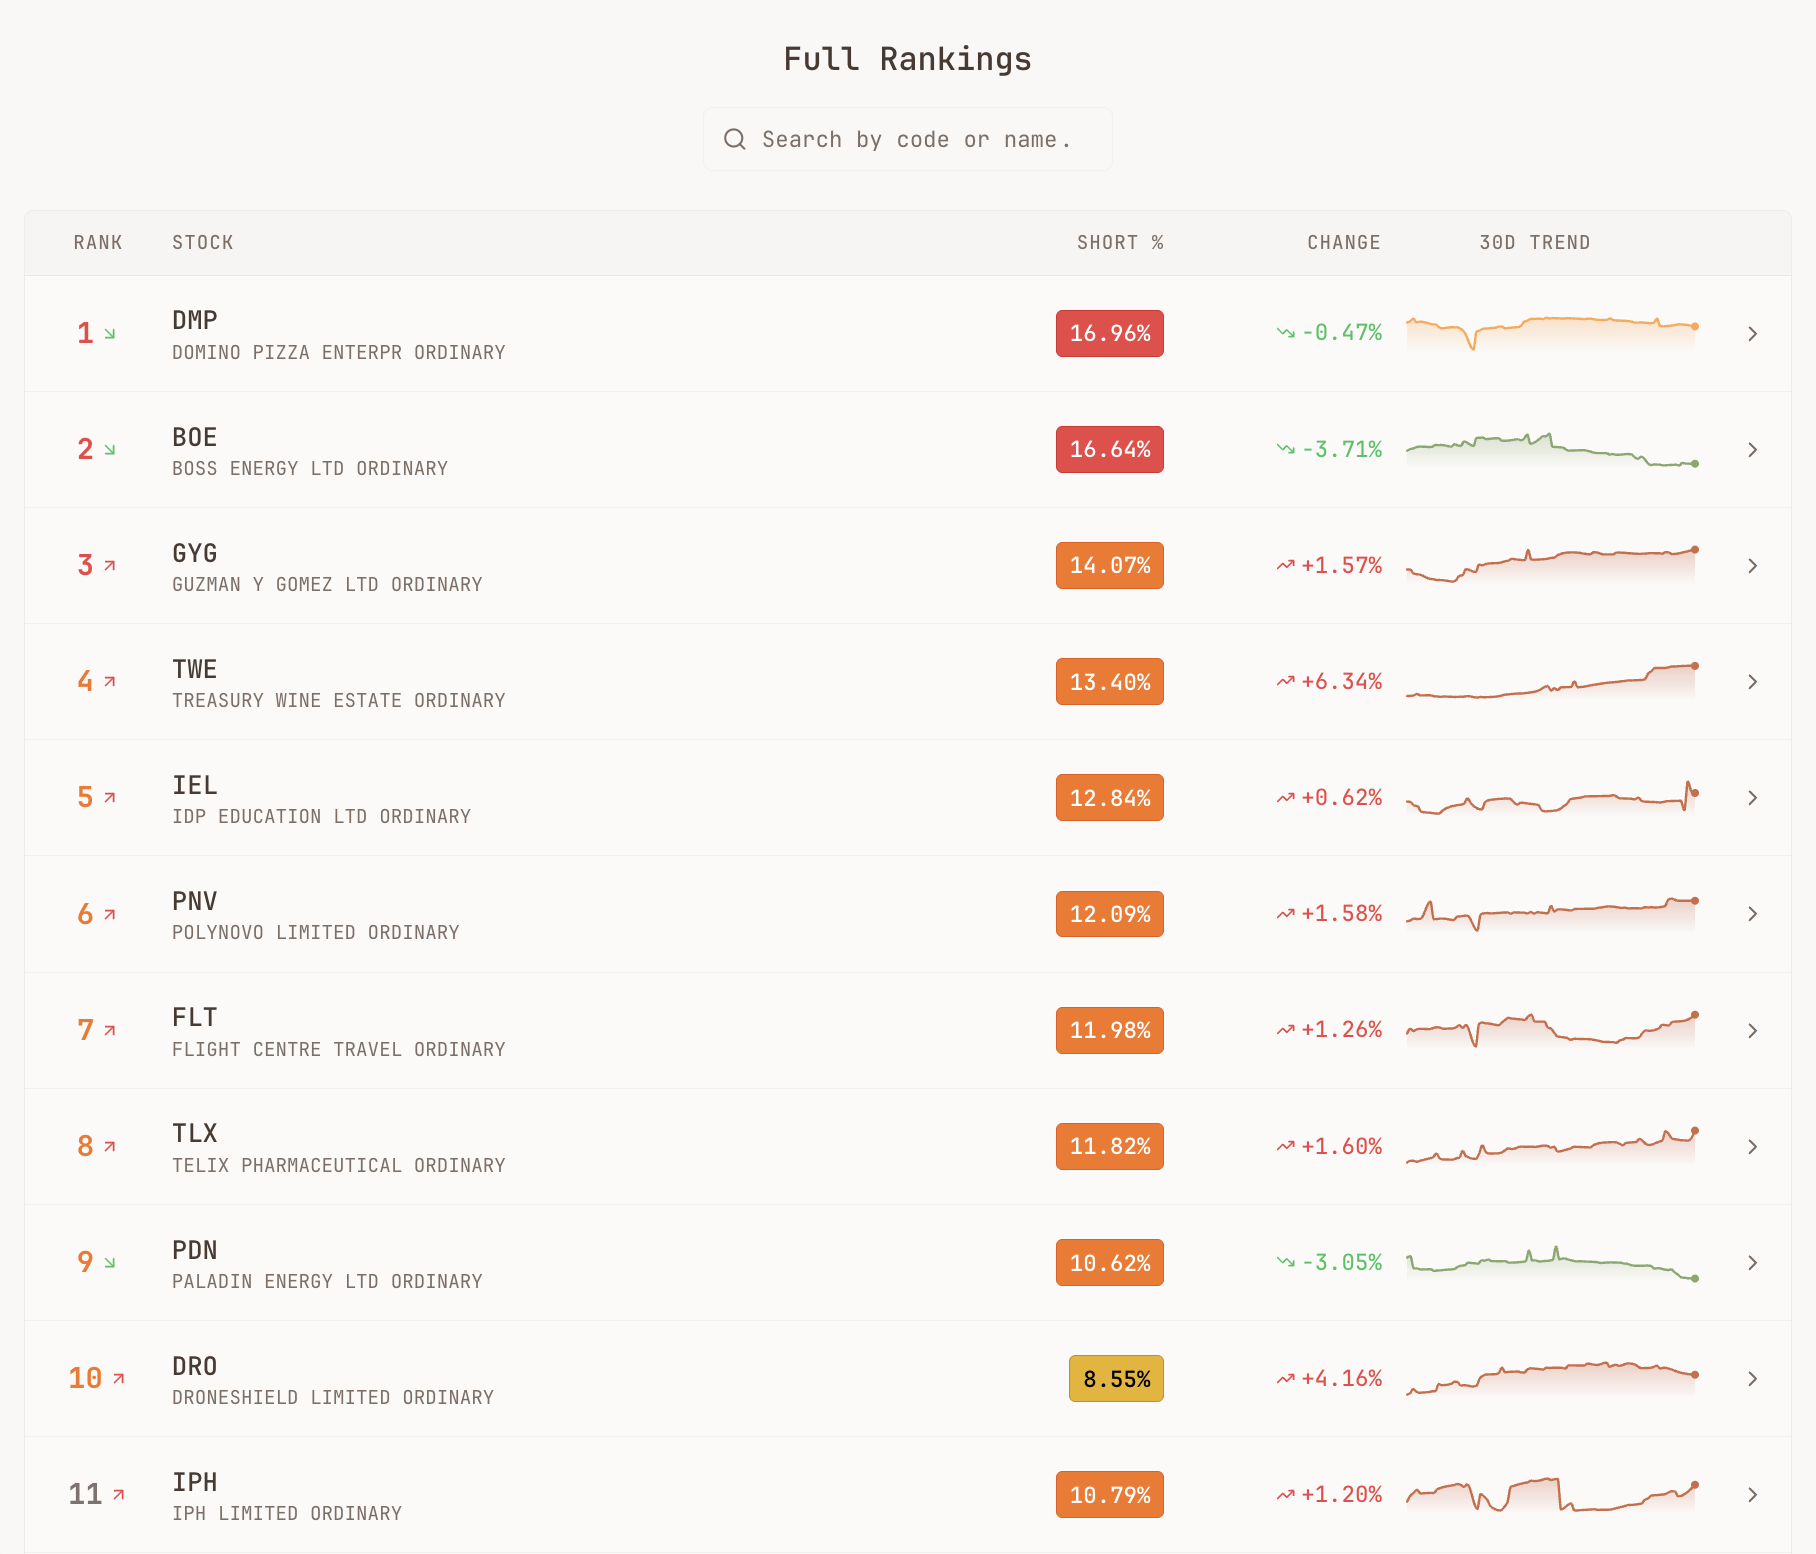
The full rankings table now shows trend sparklines so you can instantly see whether short interest is rising or falling without clicking into each stock.
Customisable Dashboard
The new dashboard puts you in control. Rather than a one-size-fits-all view, you can now arrange widgets to match your workflow:
- Top Shorted Stocks widget with configurable count
- Watchlist tracking your selected stocks with price and short interest data
- Industry Short Positions treemap showing sector-level bearish sentiment
- Stock Chart with price and short interest overlay
- Time Series Analysis for comparing multiple stocks over time
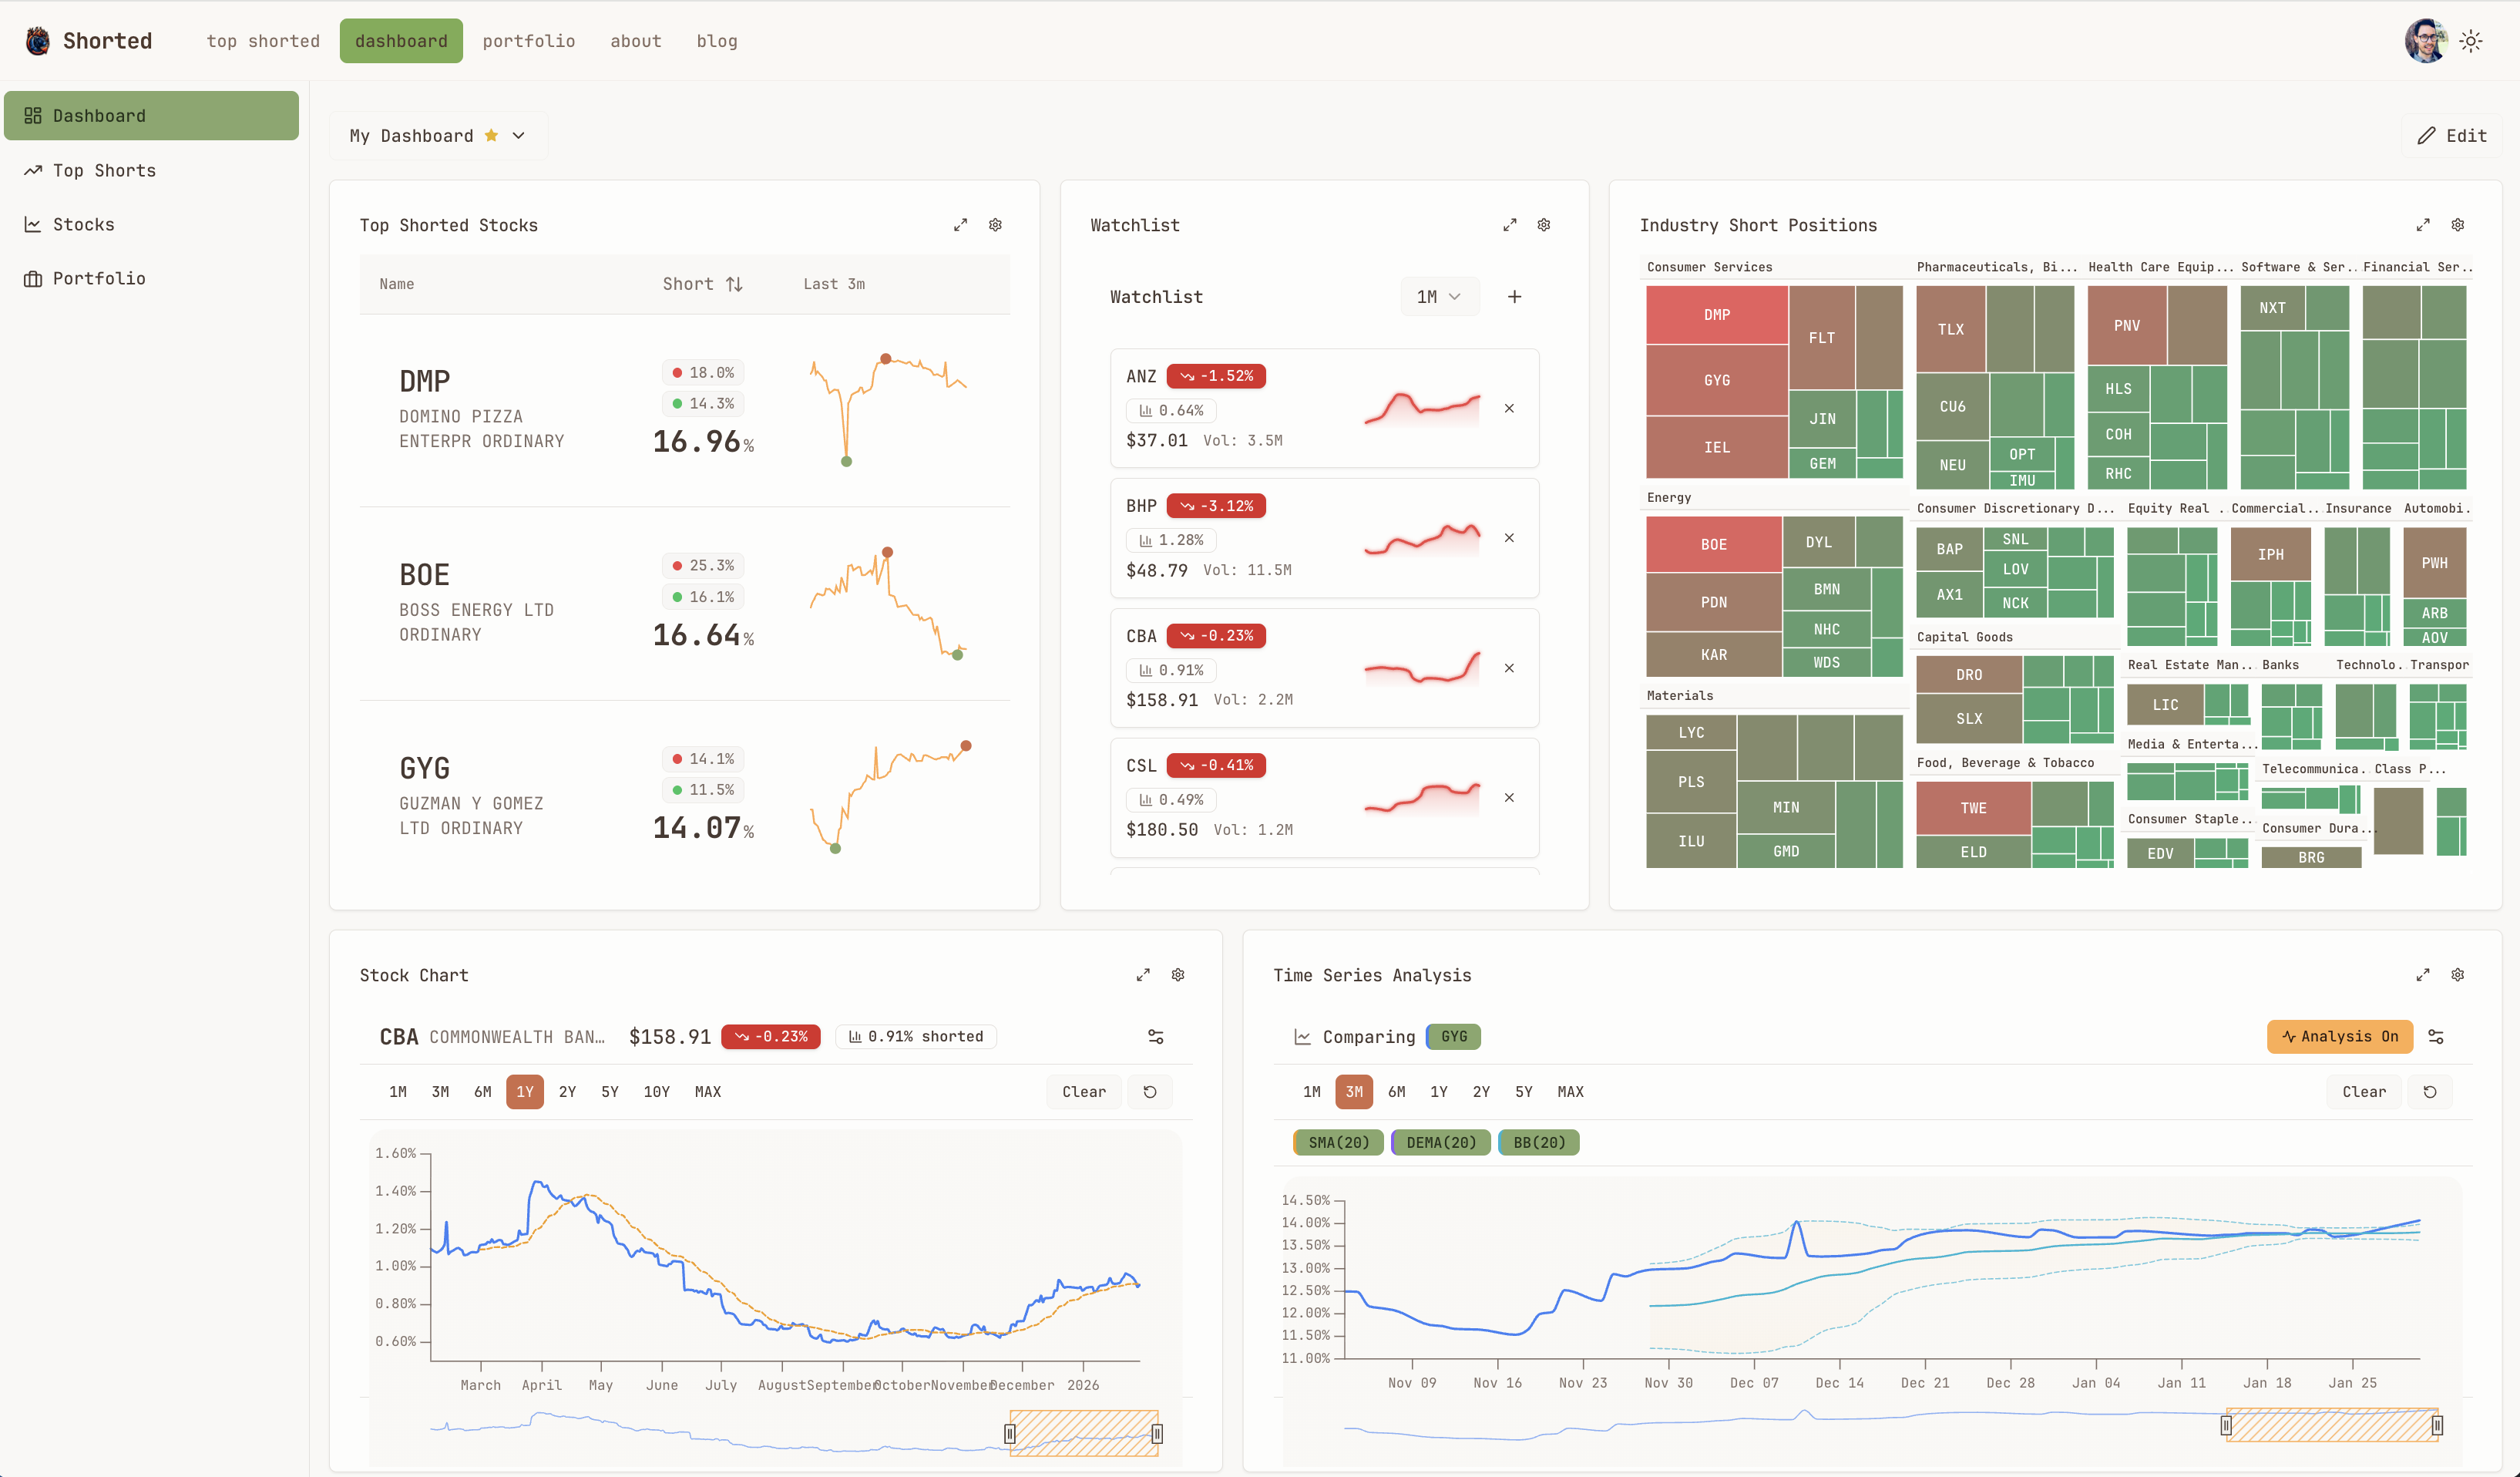
Every widget is draggable and resizable. Your layout persists across sessions, so you can set it up once and have your personalised market view ready every morning.
Enhanced Company Profiles
Individual stock pages have been enriched with significantly more data:
- Company overview with AI-generated description, sector classification, and key people
- Short Position Trends with interactive charts spanning multiple timeframes
- Key Metrics including market cap, EPS, and dividend yield
- Historical Price Data with volume analysis
- Related stocks from the same industry for easy comparison
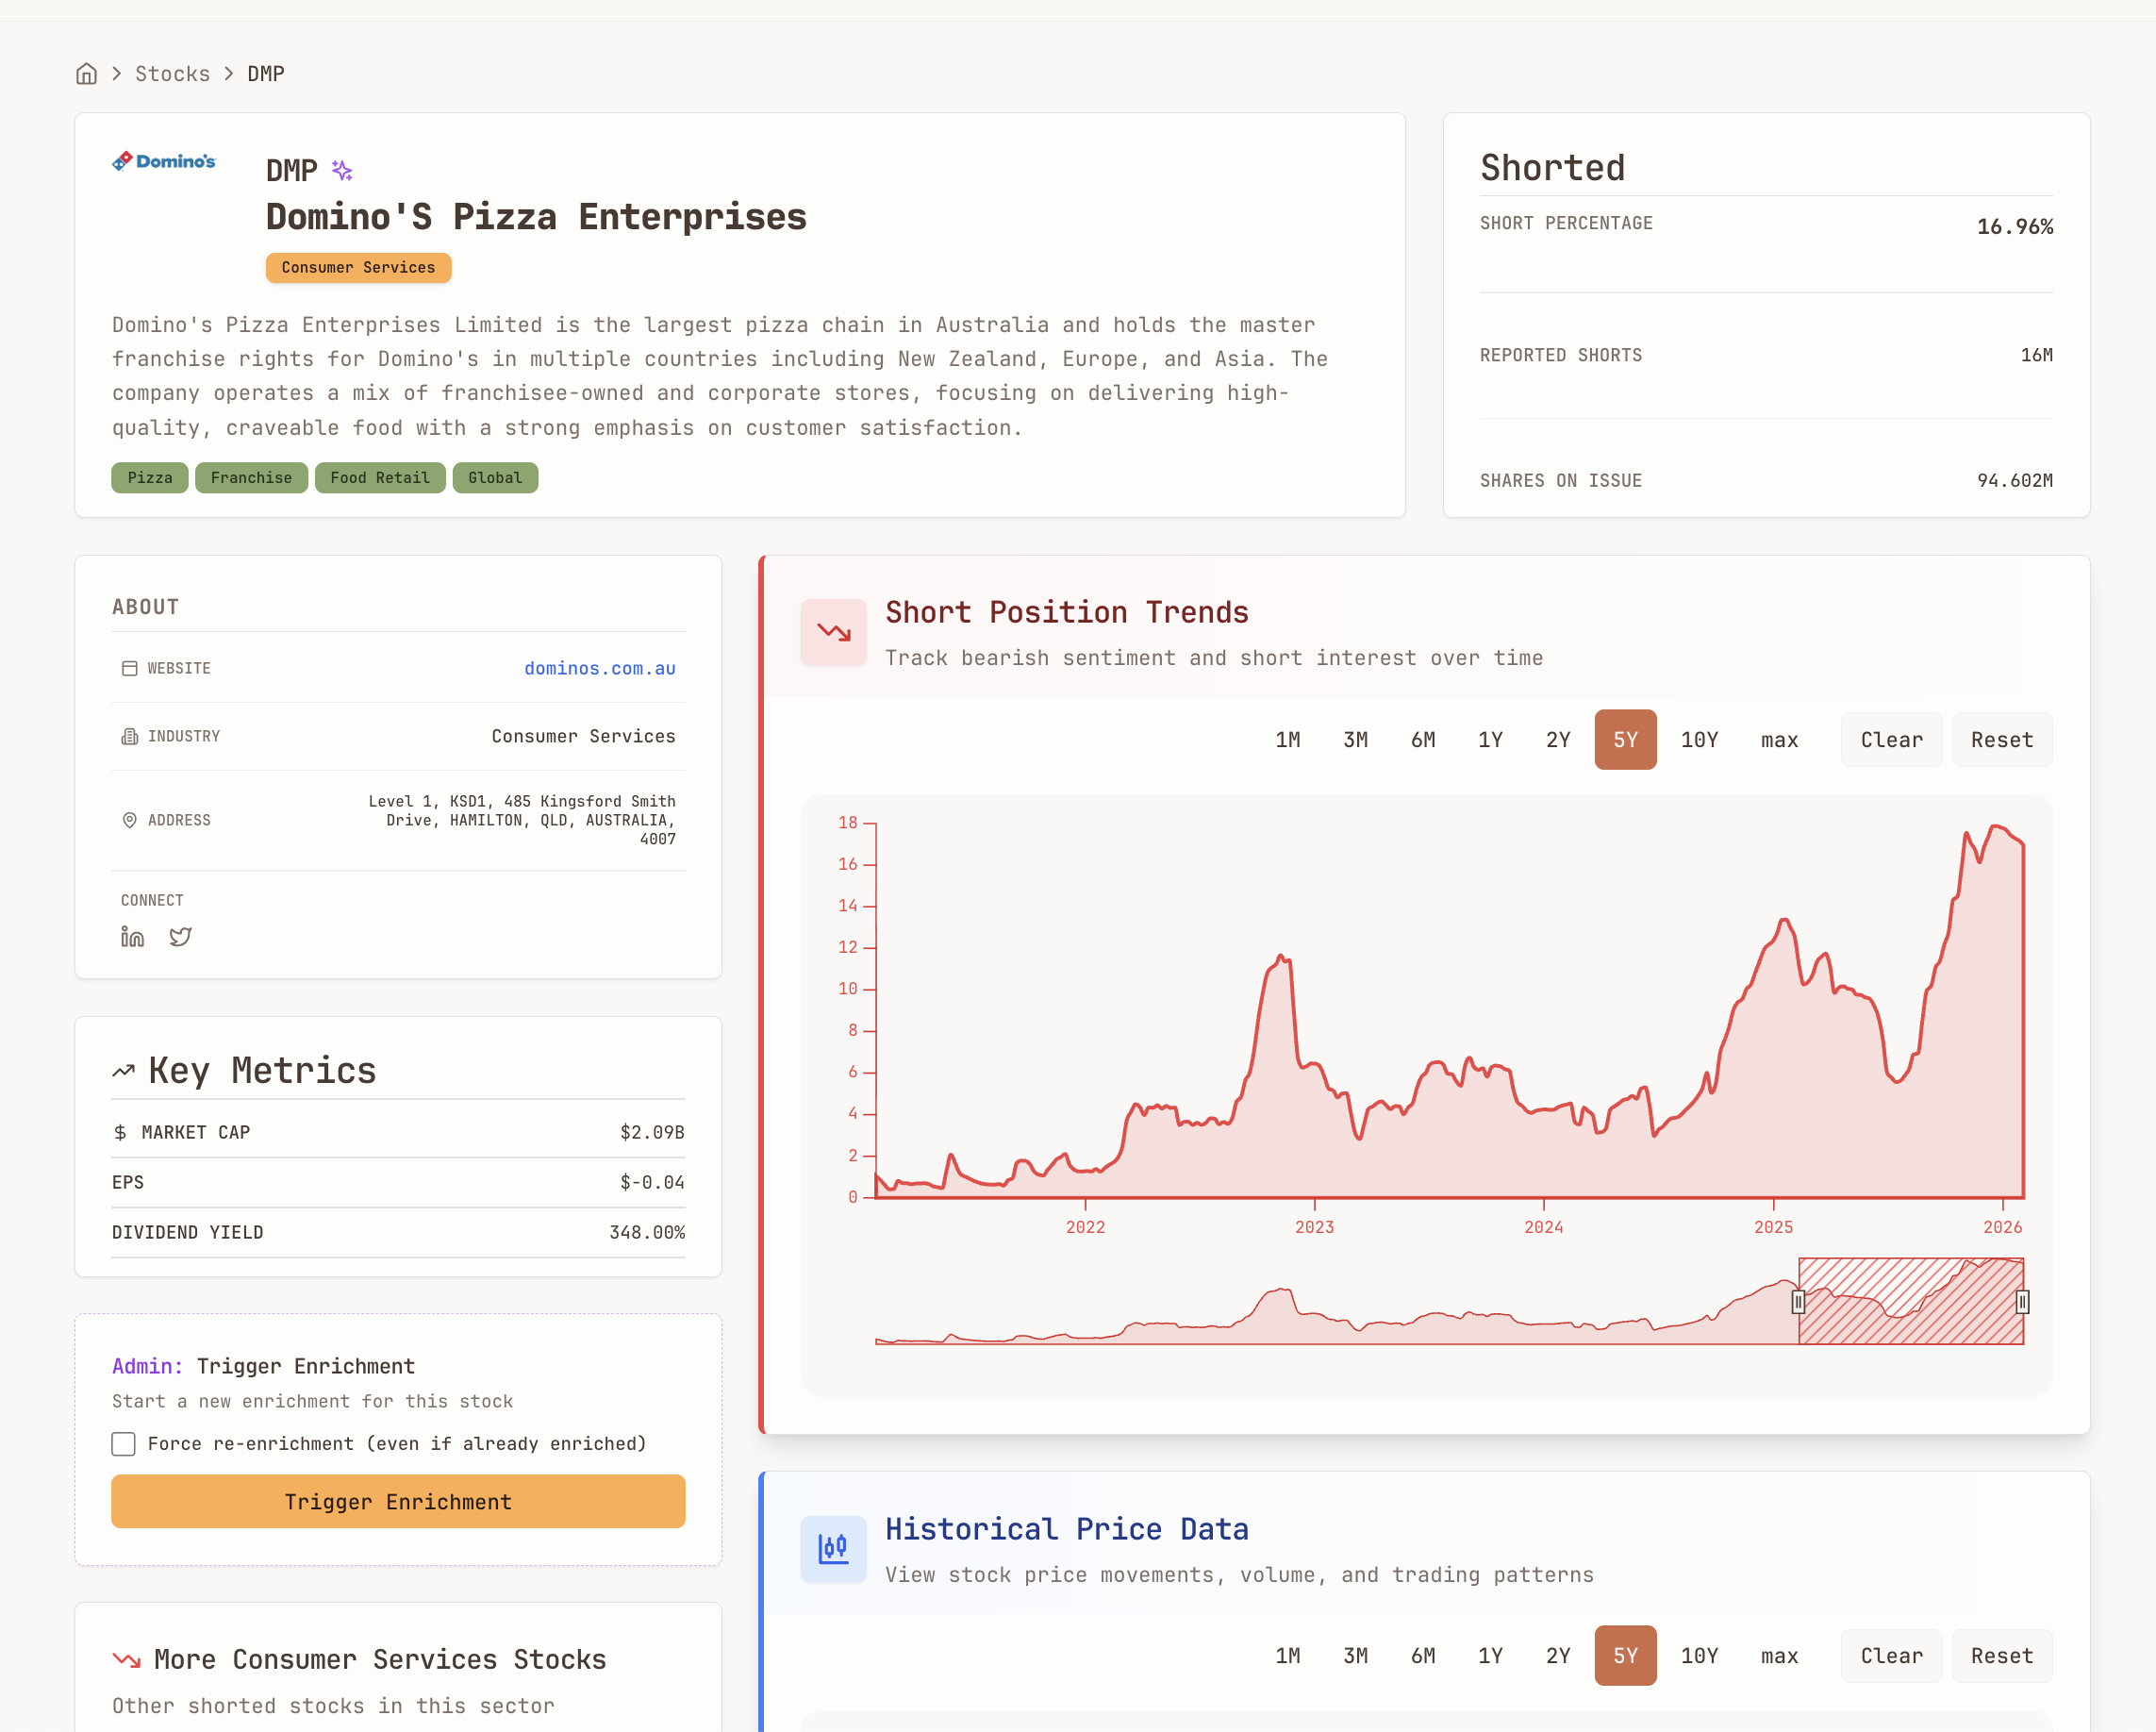
For admin users, there's even a one-click enrichment trigger to refresh company data on demand.
What's Coming Next
We're not slowing down. Here's what's on the roadmap:
- Monthly and yearly reports with deeper long-term analysis
- Alert system for significant changes in short interest on your watchlist
- API access for developers and quantitative analysts
- Mobile app for checking short positions on the go
If you haven't visited Shorted recently, now's a great time to take another look. The platform has evolved significantly, and we're just getting started.
Related Articles
ASX Short Squeeze Candidates: How to Find Them With Live Data
Ten ASX stocks carry short interest above 10% of issued capital right now — but crowded shorts alone don't make a squeeze. Here's the four-part checklist, the live screen from ASIC data, and what Zip and Pilbara Minerals teach about how squeezes actually unfold.
Hormuz, Round Two: The ASX Energy Short Rotation That Beat the News
Two weeks after we mapped ASX energy shorts, the tape rotated: Beach bears banked profits, Karoon bears reloaded, and Santos shorts tripled off a record low — all before US strikes on Iran reignited the oil risk premium.
The 10 Most Shorted ASX Stocks — July 2026
Lotus Resources tops the ASX short list at 22.81% of issued capital — shorts have added 12.4pp in 90 days. Three uranium names, Domino's, DroneShield, Telix and Flight Centre fill out July's ten most crowded bear positions, from official ASIC data.