
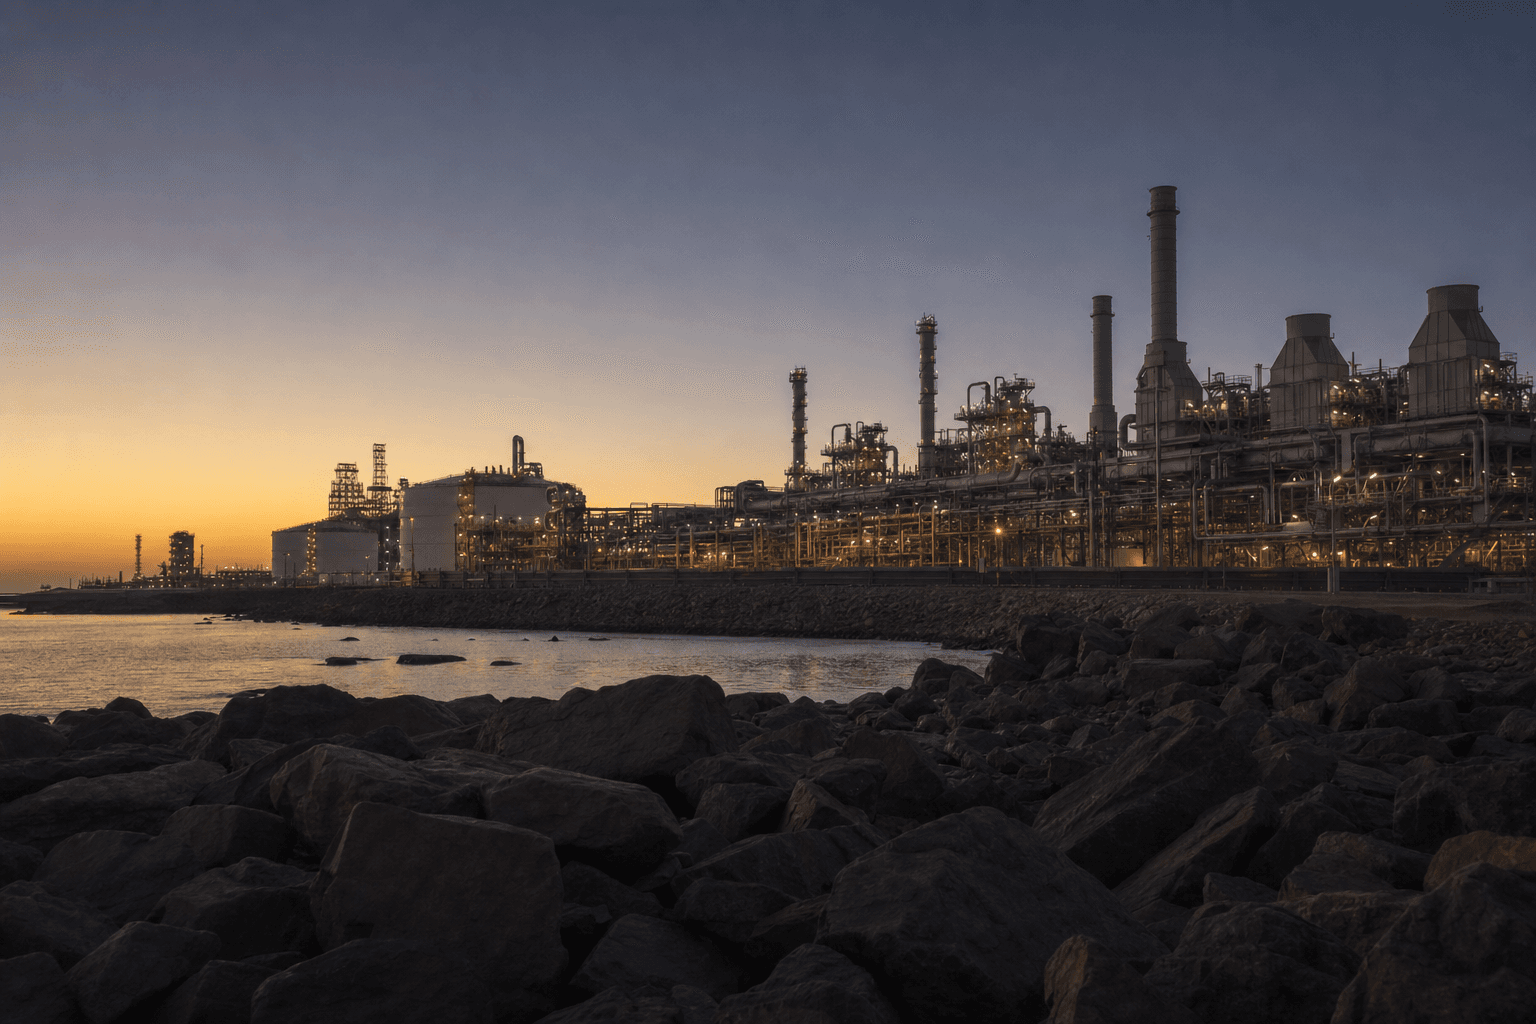
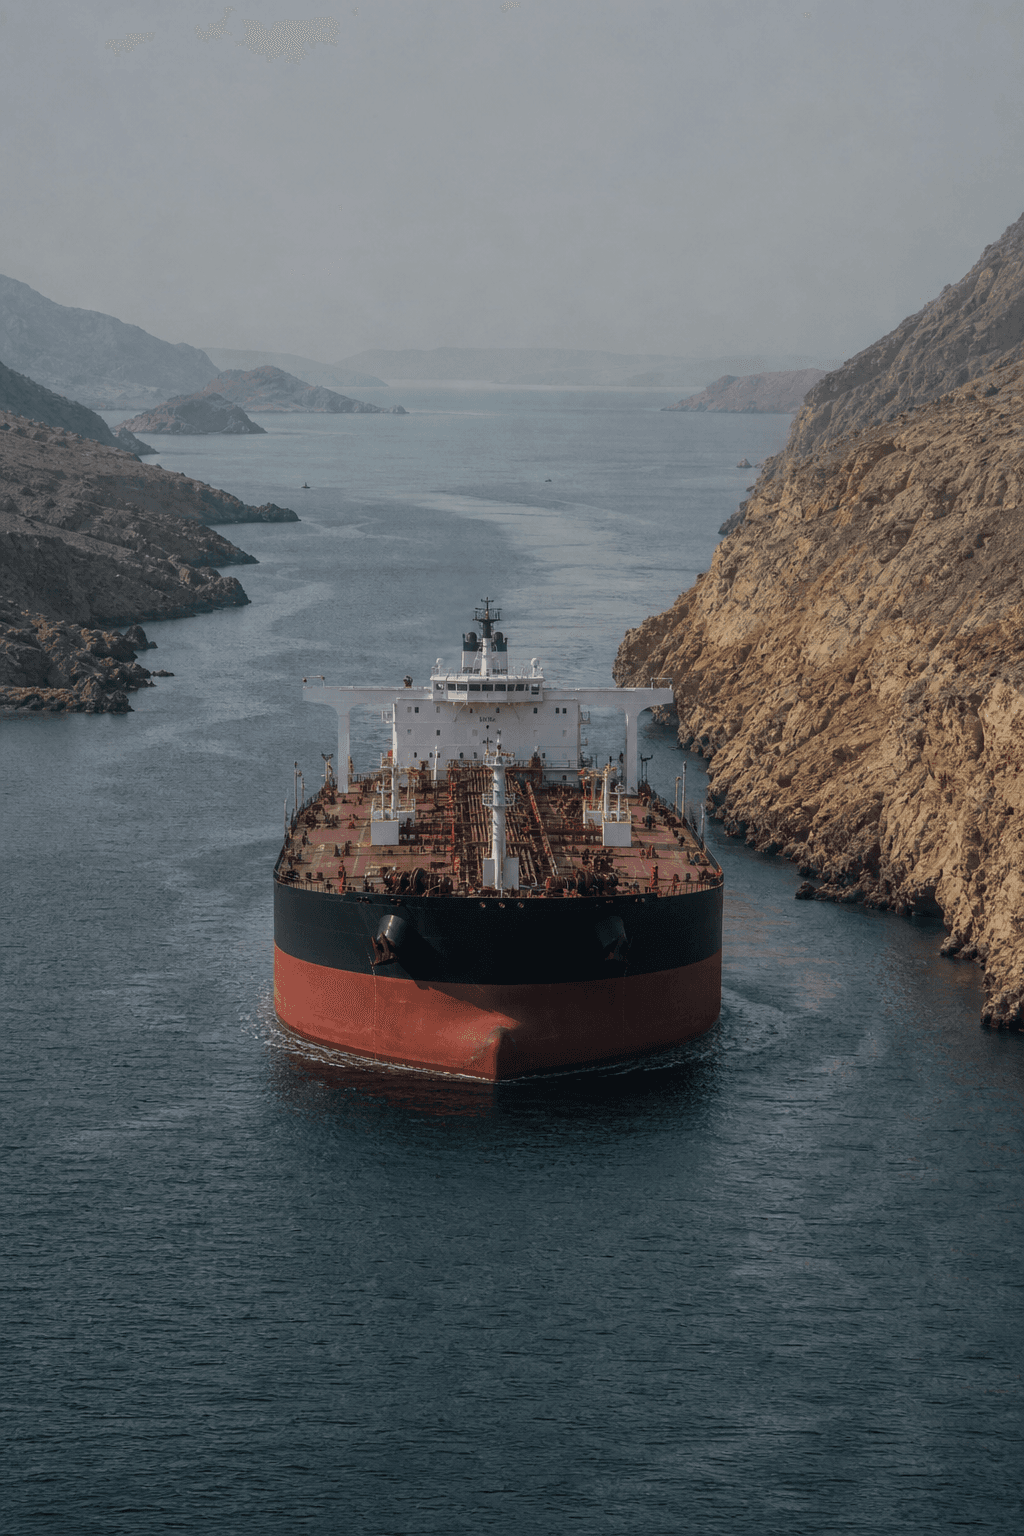
The Strait of Hormuz is effectively closed to commercial shipping again. Iran attacked three tankers in and around the strait on 6-7 July — among them the Qatari LNG carrier Al Rekayyat and the Saudi supertanker Wedyan — and US Central Command answered with two waves of strikes on roughly 170 Iranian targets across 7-8 July 12. President Trump declared the June ceasefire "over"; by Friday both sides had agreed to keep talking anyway, and Iran's foreign minister flew to Oman on Saturday to discuss "safe transit" mechanisms 34. Lloyd's List Intelligence reported traceable large-vessel crossings "effectively grinding to a halt" by 10 July 5.
That is where day 133 of the crisis finds the physical system. The financial system is telling a stranger story. Brent settled Friday at $76.01, up 5.5% for the week 6 — but 35% below its April peak and barely 6% above where it traded the day before the closure. The VIX ended the week around 15 — below where it stood before the war began 59. Meanwhile war-risk insurance for a Hormuz transit is back around 5% of hull value — twenty times the pre-crisis rate 78 — and Asian spot LNG still costs half as much again as it did in February 20. The dispersion is the story: oil markets are pricing a negotiated end, while the machinery that actually moves energy is priced for a war zone.
What the strait carries — and what routes around it
Before 28 February, roughly 20 million barrels a day of oil — about a fifth of global supply — plus close to a fifth of the world's traded LNG moved through a single narrow waterway, with around 80% of it bound for Asia 1011. The International Energy Agency calls the result "the largest supply disruption in the history of the global oil market", and its response — a coordinated release of 400 million barrels from strategic reserves across 30-plus member nations, agreed on 11 March — was the largest in the agency's history 11.
The bypass routes matter more than they did in any previous Gulf crisis, and still fall short. Saudi Arabia's East-West pipeline to the Red Sea can carry up to 7 mb/d, the UAE's Habshan-Fujairah line adds 1.5 mb/d and Iraq's Kirkuk-Ceyhan route roughly 1.6 mb/d — around 45% of normal throughput on paper, assuming none of it is bombed 12. Production shut-ins peaked at 11.2 mb/d in May; even after June's partial recovery, supply was still running some 9.4 mb/d below pre-war levels 1314.
Four and a half months in five acts
The article you may have read elsewhere — 133 days of continuous blockade — is not quite what happened. The crisis has been a whipsaw: closure, a failed April ceasefire, a dual blockade, a June memorandum that actually reopened the strait for three weeks, and now this month's collapse.
- 2026-03-11IEA members agree a record 400M-barrel emergency reserve release[ref-11]
- 2026-03-19Missile strikes hit Ras Laffan; ~17% of Qatar's LNG capacity offline for 3-5 years[ref-15]
- 2026-03-31Brent settles at $118 — the largest inflation-adjusted quarterly rise since at least 1988[ref-16]
- 2026-06-17Trump and Pezeshkian sign the 14-point Islamabad Memorandum; transit resumes within days[ref-17]
- 2026-06-24Transits peak at 51-52 a day over 24-25 June — the post-MOU high-water mark[ref-18]
- 2026-07-07Tanker attacks answered by US strikes on ~170 targets over two days; ceasefire declared 'over'[ref-2]
Trace the same arc through prices and the asymmetry jumps out. Brent went from $72 to a $118 quarter-end settle — the largest inflation-adjusted quarterly rise in records back to 1988 — peaked a second time on 30 April, then gave essentially all of it back, dipping below $70 on 1 July before this week's re-escalation pulled it back to the mid-70s 16146. European TTF gas and Asian JKM LNG never round-tripped: TTF is near €50/MWh, up roughly 60% from late February, and JKM's Q2 average of $17.50/mmBtu was 45% above a year earlier 1920. Oil found substitute supply. Gas lost Ras Laffan — and there is no strategic reserve for LNG.
The transmission machine: ships and insurance
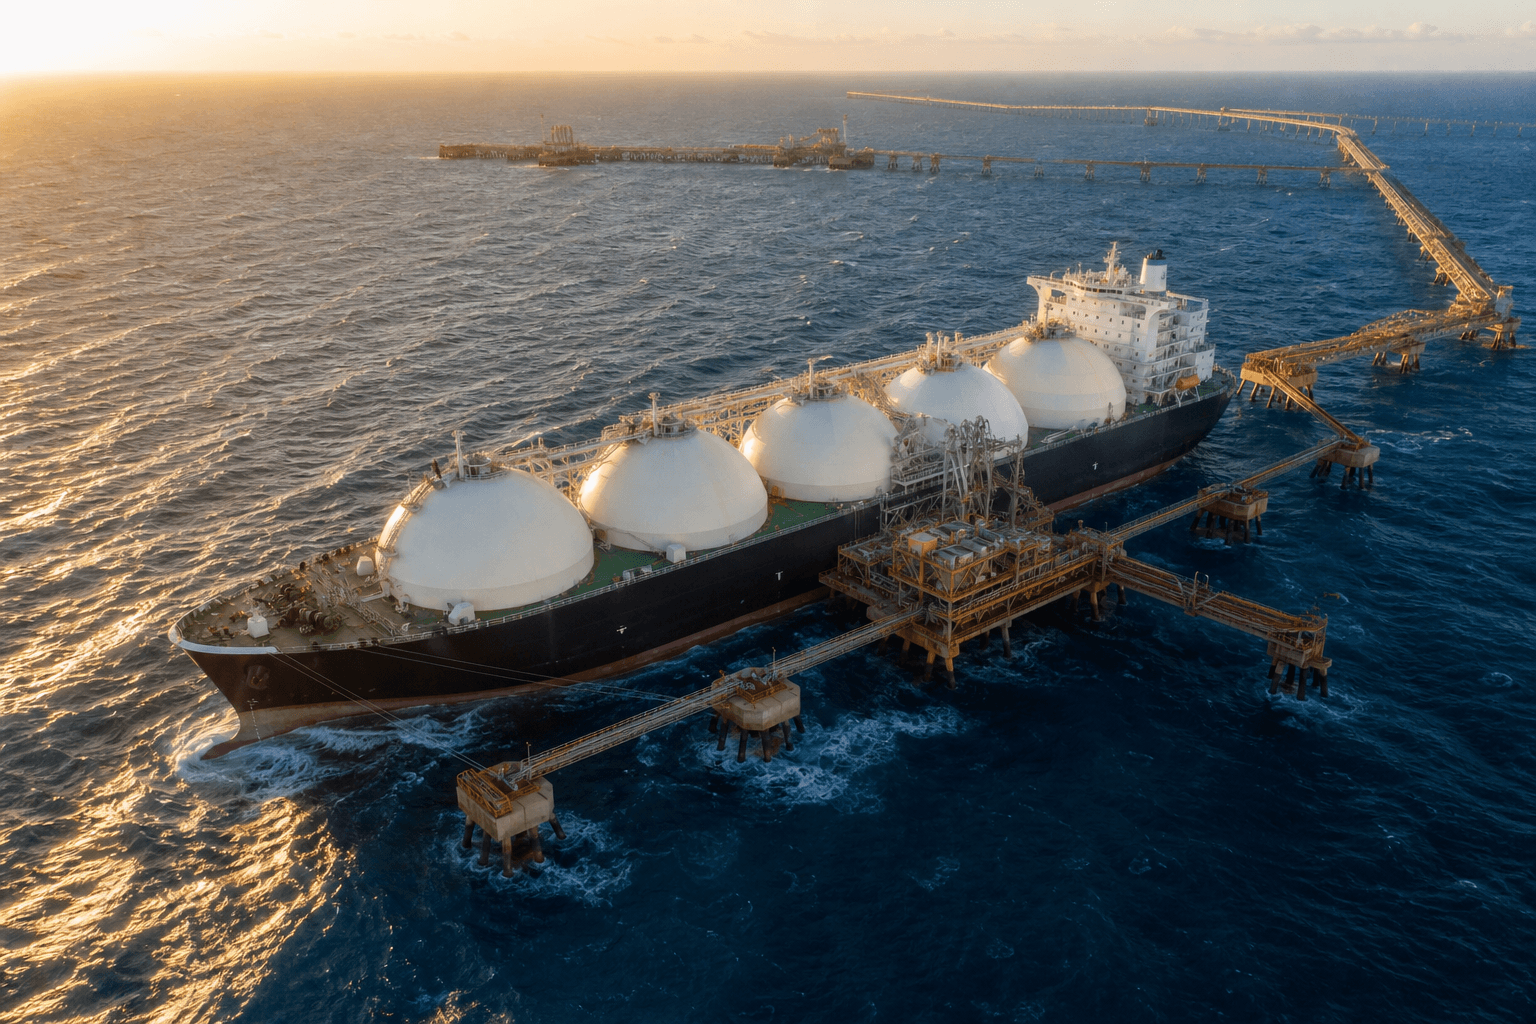
The shipping market repriced fastest and has stayed repriced. VLCC spot rates on the Middle East Gulf-China run printed a record $424,000 a day on 2 March as war-risk underwriters pulled Gulf cover 21. Hull war-risk premiums went from about 0.25% of vessel value to 1-3% within a week, with US, UK and Israel-linked ships charged roughly triple 8. Lloyd's launched a Chubb-led consortium on 19 June offering $200M of hull and P&I capacity plus $200M for cargo — and then this week's attacks arrived. "There was a softening when the MoU was signed in June, but an uptick after three vessels were attacked this week," the Lloyd's Market Association's Neil Roberts said on Friday 227.
The strangest adaptation is behavioural: mainstream commercial tankers have adopted the Iranian dark fleet's playbook. Dark transits by non-Iranian ships rose from 17 in March to 70 in May — more than two-thirds of non-Iranian movements through the strait 23. Every AIS-based count of strait traffic, including the one prediction markets settle on, now understates true flow.
Container shipping tells the paired story. Drewry's World Container Index reached $4,639/FEU on 9 July, its highest since September 2024, and Maersk raised its full-year EBITDA guidance to $8-10bn from $4.5-7bn on the back of exactly this disruption premium 2425. Aviation is the mirror image: IATA expects airlines to spend roughly $100bn more on jet fuel in 2026 and for industry profits to halve 26.
Central banks abandon the playbook
The textbook says look through a supply shock. The ECB raised rates in June — its first hike since 2023 — after euro-area inflation hit 3.2% in May, with Bundesbank president Joachim Nagel warning the energy shock "is still in the system" 2728. The Fed's new chair Kevin Warsh told the Sintra forum that "prices are too high" 29. The US 10-year yield closed Friday at 4.56%, with the 30-year having touched 5.19% in May — its highest in 19 years — while gold has retreated to $4,121 from its January record above $5,600 3031.
The IMF now sees global inflation at 4.7% for 2026, up from 4.1% last year, and says the disinflation trend that began in 2024 "has stalled" 32.
Growth: a V-shape resting on a reopening that just failed
The IMF's July update, released on 8 July — hours into the re-escalation — cut global growth to 3.0% for 2026 with a rebound to 3.4% in 2027. That V-shape rests explicitly on the strait "beginning to reopen from mid-July" and normalising by March 2027 32. Its April scenarios frame the downside: oil near $110 pushes growth to roughly 2.5% and inflation to 5.4%; disruptions extending into 2027 mean 2.0% growth for two straight years and inflation above 6% 3334.
The regional carnage is concentrated. Qatar carries the steepest downgrade of any economy — 14.7 percentage points since October, a forecast 8.6% contraction — and the July update cut Middle East and North Africa growth to just 0.7% 3432. UNCTAD expects global merchandise trade growth to decelerate from 4.7% in 2025 to 1.5-2.5% 35. The Dallas Fed's work explains who actually pays: a Hormuz cessation removes close to 20% of world oil supply, four-fifths of it bound for Asia, yet the hit to US growth is about one-twentieth of what the same shock would have done in 1980 — while it knocks roughly 1.7 percentage points off annualised growth in the rest of the world 1036.
The unhedged victims
South Asia is the crisis's demand-destruction zone. Qatar alone supplied almost all of Pakistan's 2025 LNG imports, and Qatar plus the UAE covered 63% of Bangladesh's and 59% of India's 37. Pakistan was still paying $17.37/mmBtu for spot cargoes in early July — prices that force curtailment rather than replacement buying, not just at home but across the region 38.
The slower fuse is fertiliser. The Middle East supplies nearly a quarter of the world's exported urea; prices passed $850 a tonne in April, up 80% since February, and the World Bank projects a rise of nearly 60% for 2026 39. The FAO has warned this "is not only an energy shock" but a systemic one for global agrifood systems 40. Fertiliser shocks hit food prices with a lag measured in seasons — this bill arrives in late 2026 and 2027.
Australia: windfall, vulnerability, three rate hikes
Australia sits on both sides of the ledger. Its LNG does not transit Hormuz, and it is selling into a market that has lost Ras Laffan: Shell's LNG Outlook now sees demand near 700 Mt by 2050, and notes that around a fifth of the world's monthly LNG supply has been shut in since the war began 42.
But the RBA has raised rates three times this year — to 4.35% — and held in June with an explicit bias to go again "if required" 43. The Melbourne Institute's inflation gauge jumped 1.3% in March, the strongest monthly rise on record, taking its annual pace to 4.6% 44. And the fuel-security paradox stayed ugly: a country that imports the overwhelming majority of its refined fuel was down to roughly 30 days of diesel cover by late March 57, watching country service stations run completely dry 45. Canberra cut fuel excise from 1 April — relief since extended to 2 August at a reduced rate — and used the May budget to stand up a A$3.2bn strategic fuel reserve while adding 10 days to the minimum stockholding obligation for diesel, jet fuel and petrol 4647.
The equity market kept score in sessions: on 8 July, as Trump declared the ceasefire dead, Woodside rose 3.22% to A$28.87 and Santos jumped 5.8% while the FTSE fell 1.5%, the DAX 2.2% and the KOSPI 5.4% 4849. On 15 June, the day the framework landed, the Nikkei soared 5.5% and Brent fell toward $83 5051. Woodside still trades about a fifth below the A$35.80 multi-year high it set on 7 April, when markets priced a long blockade 52.
What the shorts did
ASIC's short-position data — the numbers this platform exists to track — shows the bears splitting three ways through the crisis rather than making one sector bet.
Woodside's short interest nearly halved: 4.07% of issued capital on 27 February to a low of 2.12% in late April, and 2.50% at the latest reading. Santos ran the round trip — 0.59% pre-crisis, a 0.86% peak on 9 March as funds shorted the initial spike, a collapse to 0.21% by 11 June as the MOU rewarded the longs, and back to 0.65% now: tripled off the low in under a month. The crowded short is Beach Energy, where positions rose against the oil tailwind — 5.97% in February to a 9.88% peak in late June, 8.60% now — a bet on company-specific production problems overwhelming the macro gift. And Paladin, the uranium proxy, carries 11.39% short interest even as uranium names rallied Friday on the newly signed Australia-India uranium supply deal 53.
The bears never made one sector bet — they covered the winner, re-shorted the round-tripper, and crowded the stock with problems oil can't fix.
What the market is pricing now
Prediction markets put the odds of Hormuz traffic returning to normal by 31 July at just ~11%, even after Friday's talks-revival bounce — but roughly 65% by 31 December 54. That is a market saying the war premium is a matter of months, not years, and it is why Morgan Stanley's scenario work brackets the range so widely: a base case that glides Brent from $110 in Q2 toward $90 by Q4, against a months-long blockade scenario that pushes oil to $150-180 5556. The US EIA's own forecast has Brent averaging $70 in Q4 and a surplus building through 2027 — if the reopening holds 13. Goldman holds its European gas base case at €41/MWh but flags a tail above €100 this winter if the blockade persists 58.
The catch is that every one of those paths routes through the next two weeks: the memorandum obliges Washington to fully lift its naval blockade of Iranian ports by 19 July 17, Tehran and Washington are still arguing over who controls transit 4, and war-risk pricing — which softened after the MOU only to jump again on this week's attacks — follows demonstrated calm, not announcements 7. Until the dark tankers switch their transponders back on and war cover stops pricing the strait like a battlefield, the physical system will keep disagreeing with the ceasefire trade — and the most informative prices on the ASX won't be the ones on the screen at 4pm, but the short books quietly picking which energy stories survive the peace.