The Oil Shock Short Sellers Ignored — Except for One ASX Stock


The Oil Shock Short Sellers Ignored — Except for One ASX Stock
The 2026 Israel-Iran war produced the largest oil supply shock in modern history. The Strait of Hormuz — through which roughly 20% of the world's oil and a fifth of its LNG flows — was effectively closed to commercial shipping for months. Brent crude rocketed from around US$72 a barrel in late February to peaks above US$115–126 in April, before sliding back to roughly US$72–82 by late June as US-Iran peace talks advanced.
You'd expect a move like that to light up the short-selling data on ASX energy stocks. It didn't — at least not the way most people assume. Short sellers barely touched Woodside and Santos. Instead, the bearish bets concentrated on a single name: Beach Energy (BPT), which sits near 9.8% of issued capital shorted — among the highest on the entire ASX.
That gap between the macro story and the positioning is the real story. It tells you the shorts weren't making a bet against oil. They were making a bet against a company.
A 60-day round trip in the oil price
The conflict escalated sharply in late February 2026, when US and Israeli strikes hit Iranian nuclear and military sites. Within days, Iran declared the Strait of Hormuz closed and began attacking vessels. The International Energy Agency coordinated its largest-ever strategic petroleum release — 400 million barrels — to plug the gap, while Hormuz flows collapsed from around 20 million barrels a day to under 3 million through the worst of the crisis.
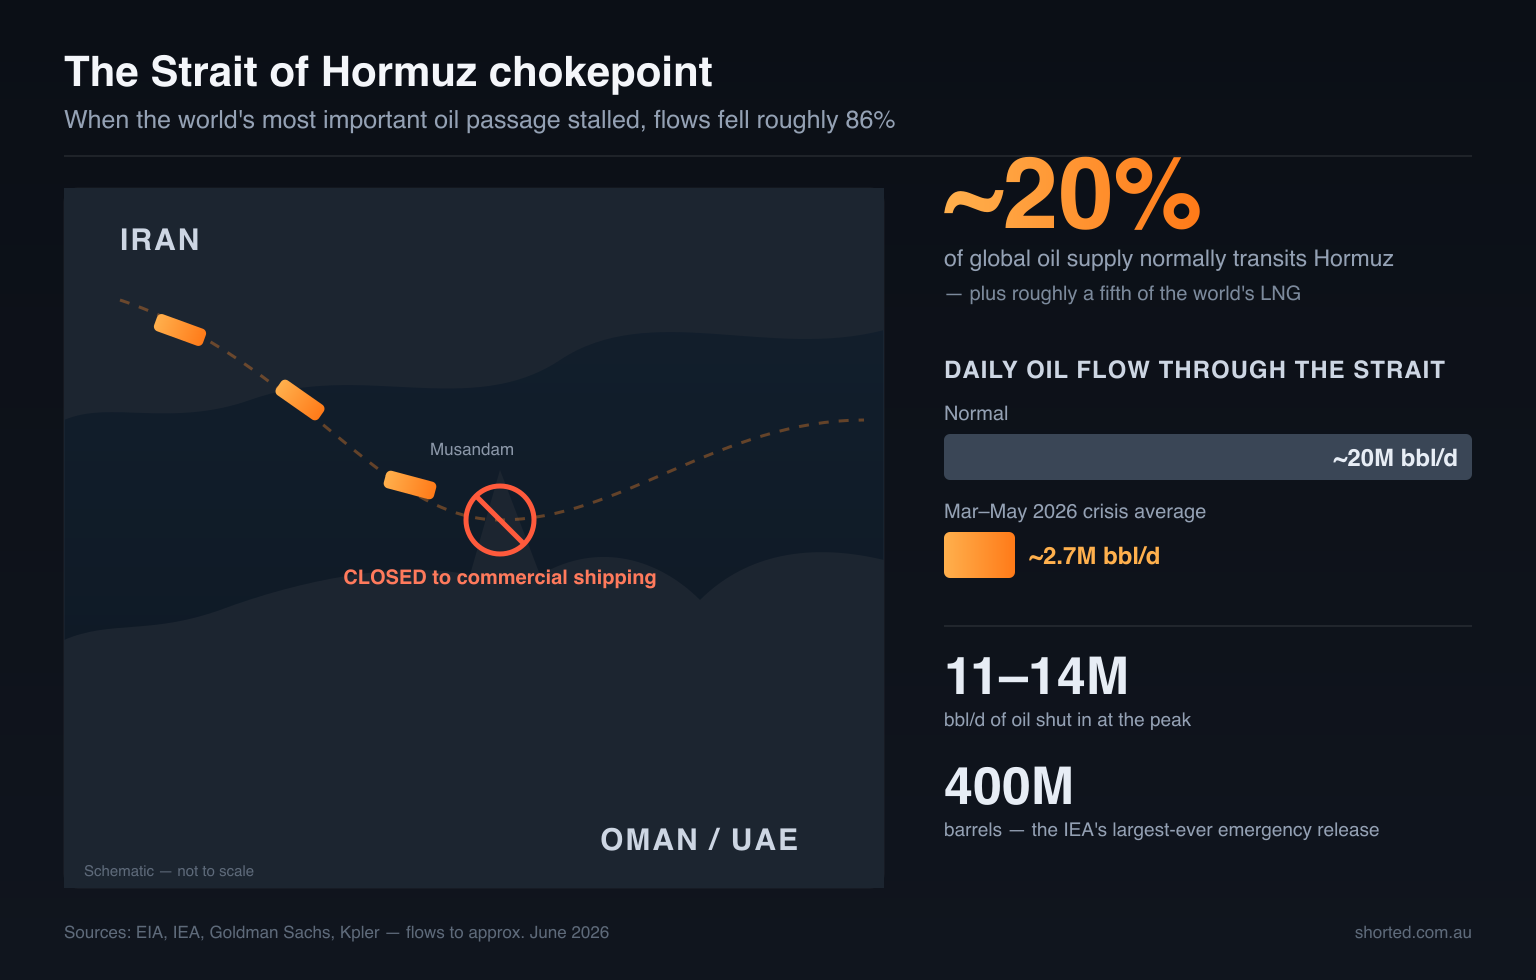
The reason a regional war becomes a global oil shock: a single narrow strait carries about a fifth of the world's seaborne oil and a comparable share of its LNG. When it stalled, daily flows fell roughly 86%. Sources: EIA, IEA, Goldman Sachs, Kpler.
| Date | Brent crude | Context |
|---|---|---|
| 27 Feb 2026 | ~US$72/bbl | Day before major escalation |
| 9 Mar 2026 | ~US$107/bbl | Supply-disruption fears peak |
| Late Apr 2026 | ~US$114–126/bbl | Conflict peak |
| 15 Jun 2026 | ~US$83/bbl | US-Iran deal / Hormuz reopening hopes |
| 25 Jun 2026 | ~US$72–73/bbl | Late-June pullback |
For ASX energy names, this was a classic volatility trade. Woodside (WDS), Santos (STO) and Karoon (KAR) rallied 10–30%+ into the spike. Then, when ceasefire hopes emerged, they sold off hard — on 8–9 April, after a ceasefire announcement, the S&P/ASX 200 Energy Index fell about 7.3% in a session while the broader ASX 200 rose 2.8%, a ten-percentage-point divergence in a single day.
A quick note on the data
ASIC publishes aggregated short-position data on a T+4 basis, so the latest reliable figures here run to roughly 22 June 2026. Short sellers must report a net short position once it exceeds A$100,000 in value and 0.01% of securities on issue. Oil prices and the conflict status were moving fast at the time of writing — treat every figure as a snapshot, not a live quote.
Where the shorts actually sat
Here's the short-interest picture across the major ASX energy names, from ASIC-derived data around 22 June 2026:
| Ticker | Company | Short interest (% of issued capital) | Read |
|---|---|---|---|
| BPT | Beach Energy | ~9.8% | Most-shorted major oil/gas name |
| KAR | Karoon Energy | ~3.6% | Covered down from a ~9.9% peak in February |
| WDS | Woodside Energy | ~2.8% | Below the peer median |
| WOR | Worley | ~2.3% | Middle East project delays |
| WHC | Whitehaven Coal | ~1.6–1.9% | Indirect energy-security play |
| ORG | Origin Energy | ~1.5% | Defensive utility + hedged LNG |
| VEA | Viva Energy | ~1.2% | Refiner/retailer |
| STO | Santos | ~0.3–0.4% | Least-shorted major |
The shape of that table is the whole argument. A genuine macro bet against oil — a view that prices would mean-revert and crush energy earnings — would show up as broad-based shorting across the sector. It didn't. Woodside and Santos, the two biggest and most oil-and-LNG-exposed names on the index, are barely shorted at all. Energy isn't even close to the dominant short theme on the ASX in mid-2026; that crown belongs to lithium, uranium, healthcare and consumer names, several of which carry double-digit short interest.
What we have instead is a single, concentrated, company-specific position. So the question becomes: why Beach?
The Beach Energy paradox
On paper, Beach is the most oil-and-gas-price-leveraged of the three pure-play candidates — smaller, more concentrated, no hedging. In a genuine oil shock, it should have been the winner. Instead it was the most heavily shorted, and the short thesis was rewarded.
The reasons are operational, not macro:
- A production downgrade. FY26 guidance was cut to 19.4–20.3 MMboe (from 19.7–22.0), on weather and compressor ramp-up issues.
- A dividend cut. The interim dividend was slashed 67%.
- Domestic gas drag. Beach's WA gas exposure benefits far less from global oil moves than its tickers suggest; its realised gas price actually fell 6% quarter-on-quarter even as realised oil hit A$125/bbl.
- The chart. The share price sat near a five-year low, down roughly 17–18% year-to-date in a year when WDS was up more than 20%.
This is the crucial point for anyone reading short data during a geopolitical event: even as oil prices surged, Beach underperformed its peers. The shorts weren't fighting the oil tape — they were right about the company's own problems, and the macro tailwind wasn't enough to bail it out.
The shorts weren't betting against oil. They were betting against a company — and the oil rally wasn't enough to save it.
One honest caveat worth flagging, because it matters for how you read any single number: BPT's short interest is cited differently across data providers — around 9.69% (FNArena), 9.81% (ShortInterest.au), and as high as 12.91% (Rivkin). Those gaps usually come down to different reporting cut-offs and whether the denominator is issued capital or free float. The ASIC-derived ~9.8% figure is the most defensible baseline, but the spread is a useful reminder to check the source and the denominator before quoting a headline short percentage.
Why the majors got a pass
Woodside and Santos tell the opposite story. Both stayed lightly shorted — WDS near 2.8%, STO near an almost trivial 0.3–0.4% — right through the spike. A few reasons:
- Their cargoes don't transit Hormuz. Australian LNG sails to Asia without passing through the chokepoint, so the supply-disruption premium was a tailwind without the shipping risk.
- Contracted cash flow. Long-term Asian LNG contracts give visible, defensive earnings — a poor target for a short.
- Quality and scale. Santos was running unit production costs under US$7/boe, its best in a decade; Woodside posted record 2025 production. Low short interest here reads as a quality signal, not complacency.
- Australia is a net energy exporter. As AMP's Shane Oliver put it, the country is "relatively well placed because we are a net energy exporter and so may benefit from higher prices for gas exports."
Karoon is the in-between case — and the cleanest illustration of shorts trading the volatility itself. Its short interest fell from a ~9.9% peak on 27 February, right before the spike, to ~3.6% by late June. That's textbook short covering into a rally: bears who were positioned before the war bought back stock as oil ran, then began re-entering as peace talks pulled prices back down.
What to watch from here
The Iran war short story isn't settled — it's paused. A few things will decide where the positioning goes next:
- Hormuz. The whole risk premium hangs on the strait staying open. As ICIS's Ajay Parmar put it: "This is about Hormuz risk, not retaliation. If shipping stays open, stocks can work through it… If it doesn't, all bets are off." A collapse of the 60-day negotiation window would re-arm the macro trade in a hurry.
- Beach's operations. The BPT short is an operational thesis. If the company stabilises production and the Waitsia gas plant runs at nameplate, a crowded ~10% short position becomes squeeze fuel. If the downgrades continue, the bears stay paid.
- The ASIC data itself. Because reporting runs on T+4, you're always reading positioning that's four days stale during a fast-moving event. The direction of travel — shorts rising or covering week over week — is more informative than any single day's snapshot.
The headline takeaway is one worth keeping for the next crisis: a giant macro shock doesn't automatically produce a giant macro short. In 2026, the biggest oil event in a generation barely moved the needle on the majors — and the heaviest bet on the board was about one company's compressors, not the price of crude.
Track ASX energy shorts on Shorted
You can follow every name in this article live on Shorted.com.au — short-interest trajectories, price action, and how positioning shifts week to week:
Or compare bearish bets across the whole sector on our industry analysis page →
This content is for informational purposes only and does not constitute financial advice. Short-position figures are derived from ASIC data published on a T+4 basis and were accurate as at approximately 22 June 2026; oil prices and conflict status were moving rapidly. Always conduct your own research before making investment decisions.
Related Articles
ASX Short Squeeze Candidates: How to Find Them With Live Data
Ten ASX stocks carry short interest above 10% of issued capital right now — but crowded shorts alone don't make a squeeze. Here's the four-part checklist, the live screen from ASIC data, and what Zip and Pilbara Minerals teach about how squeezes actually unfold.
Hormuz, Round Two: The ASX Energy Short Rotation That Beat the News
Two weeks after we mapped ASX energy shorts, the tape rotated: Beach bears banked profits, Karoon bears reloaded, and Santos shorts tripled off a record low — all before US strikes on Iran reignited the oil risk premium.
The 10 Most Shorted ASX Stocks — July 2026
Lotus Resources tops the ASX short list at 22.81% of issued capital — shorts have added 12.4pp in 90 days. Three uranium names, Domino's, DroneShield, Telix and Flight Centre fill out July's ten most crowded bear positions, from official ASIC data.